Introduction
Coronary artery disease (CAD) remains the leading cause of death worldwide. For decades, clinical assessment of CAD has revolved around detecting luminal stenoses that impede blood flow. However, growing evidence shows that the nature of atherosclerotic plaque, not just the degree of stenosis, critically determines a patient’s risk of myocardial infarction (MI). Many MIs arise from plaques that are not severely obstructive but are biologically “vulnerable,” that is, characterized by large lipid cores, thin fibrous caps, inflammation, and positive remodeling.1-3 Identifying such high-risk plaques before they cause an acute event is a major goal of preventive cardiology.
Coronary CTA for Robust CAD Diagnosis
Coronary CTA (CCTA) has emerged as a noninvasive imaging technique that enables visualization of the coronary lumen, arterial wall, and plaque within these structures. Initially, CCTA was used primarily for the detection of obstructive CAD to guide revascularization therapy. A normal CCTA confers a very high negative predictive value for ruling out significant CAD and carries excellent prognosis.4,5 Trials like PROMISE, SCOT-HEART, and CREDENCE had established CCTA as at least equivalent, if not superior, to functional stress testing for initial evaluation of chest pain.6-8 Trials like DISCHARGE showed lower rates of procedure-related complications using CCTA in women and patients <65 years of age, but a similar incidence of major adverse cardiac events (MACEs), defined as cardiovascular death, a nonfatal MI, or a nonfatal stroke, between CCTA and invasive coronary angiography among patients with stable chest pain and intermediate CAD risk.9-11 In its 2019 guidelines, the European Society of Cardiology designated CCTA as first-line diagnostic testing for suspected CAD, equivalent to functional stress testing (class I recommendation) and an alternative to invasive coronary angiography when functional testing is nondiagnostic (class I recommendation).12 Complementing this, the 2021 American College of Cardiology/American Heart Association guidelines recommend CCTA for evaluation of chest pain in intermediate-risk patients to exclude plaque and obstructive CAD (class I recommendation).13
Plaque Formation Pathophysiology
Coronary plaque formation is a complex, multifactorial process driven by endothelial dysfunction, lipid accumulation, and chronic inflammation.14 The inciting event is typically endothelial injury, followed by subendothelial low-density lipoprotein deposition and oxidation. This leads to a downstream cascade of macrophage recruitment and transformation into foam cells (responsible for low attenuation in plaques). Proliferation of smooth muscle cells, synthesis of extracellular matrix, and further migration and apoptosis of white blood cells lead to plaque progression, fibrous cap formation, and chronic inflammation. Inflammatory cells secrete proteases that degrade the fibrous cap and increase the risk of plaque rupture. Pro-inflammatory cytokines promote osteogenic differentiation of smooth muscle cells and plaque mineralization, which have important prognostic implications. Early microcalcifications (<15 μm) are associated with plaque instability and increased risk of rupture, while macrocalcifications appear as the inflammation resolves and are typically associated with plaque stability.15,16
Current Risk Stratification Clinical Tropes and Diagnostic Dilemmas
The coronary artery calcium (CAC) score is widely used for risk stratification of asymptomatic patients. In the acute setting at a single institution, a negative coronary calcium score (CAC = 0) showed high negative predictive value (99.3%) for obstructive CAD in low- or intermediate-risk patients.17 However, the direct causal relationship between CAC and MACE is unclear. In fact, heavily calcified plaque measuring >10,000 Hounsfield units (HU) carries a lower risk of acute coronary syndrome on a per-patient and per-lesion basis, likely corresponding to histopathologic macrocalcifications related to resolving inflammation and plaque stability.18 In the multicenter PROMISE trial, 25% of patients who suffered MACE had a CAC score of 0.19 Since the CAC burden and score increases with age, CAC score may underpredict the risk of MI in younger patients (especially those with noncalcified plaques) and overpredict the risk of MI in older patients.
Rationale for Plaque Quantification by CCTA: A Shifting Clinical Management Paradigm
Over the last decade, successive improvements in image quality and the advent of powerful software have dramatically enhanced CCTA’s plaque visualization capabilities. It is now feasible to quantify plaque volumes (in mm³) and differentiate plaque subcomponents by CT density (eg, calcified versus lipid-rich) on standard CCTA scans. CCTA could noninvasively characterize plaque, defined as tissues 1 mm2 within or adjacent to the coronary artery lumen in 2 independent planes that are distinct from the lumen and epicardial fat.20 When compared to the intravascular US (IVUS), the gold standard for plaque detection and characterization, a meta-analysis of 42 studies with 1360 patients found high sensitivity (93%) and specificity (92%) for CCTA plaque detection and no statistically significant differences in plaque volumes or area.21 Furthermore, low-attenuation plaques (LAPs), characterized by ≤30 HU, correspond well to lipid-rich plaques and thin-capped fibroatheromas on IVUS.22,23 The Society of Cardiovascular Computed Tomography (SCCT) and the North American Society for Cardiovascular Imaging acknowledge that LAP burden is a strong independent predictor of incident MI and future cardiac events beyond stenosis severity alone.24
A substantial body of evidence indicates that CCTA-derived plaque metrics are independently associated with clinical outcomes and offer additional prognostic value beyond traditional risk factors.1,3,20,25-30 The total burden of plaque found on CCTA is a strong predictor of events. A recent study using artificial intelligence (AI) quantification in ~1600 patients reported that in those with total plaque volume (TPV) in the highest quartile or ≥238.5 mm³ (an outcome-optimized threshold), the risk of MI was 5-fold higher.29 This association remained after controlling for stenosis severity and clinical risk score.
Numerous studies identify LAP as an important prognostic marker. In a post hoc analysis of 1769 patients from the SCOT-HEART trial, MACE was 3 times more frequent among those with LAP or positive vessel remodeling; in fact, an LAP volume increase of 4% was associated with a 5-fold increase in the risk of future MI and showed stronger predictive value than luminal stenosis grading.25,30 A secondary analysis of the PROMISE trial showed that the presence of any high-risk plaque feature (eg, LAP, spotty calcification, positive remodeling, napkin ring sign) was associated with a 70% higher risk of MACE, especially in women and younger patients.20 In a multicenter study of 252 patients who underwent CCTA and invasive fractional flow reserve (FFR), high-risk plaque features increased the risk of ischemia by 3- to 5-fold.28 In the ROMCAT-II trial, the presence of high-risk plaque features remained a significant predictor of acute coronary syndrome even after adjusting for 50% vessel stenosis, 70% vessel stenosis, and clinical risk factors (eg, age, sex, and number of cardiovascular risk factors).26
Plaque analysis using CCTA has also demonstrated the therapeutic basis of risk-modifying medications, paving the way for personalized therapeutic pathways and noninvasive imaging follow-up. In multiple large studies (such as the multinational PARADIGM study with 2252 patients), CCTA showed that lipid-lowering drugs such as statins were associated with slower progression of overall coronary plaque volume, increased plaque calcifications, and reduction in high-risk plaque features.31,32 In the randomized, placebo-controlled EVAPORATE trial, patients on icosapent ethyl had 17% and 9% reduction in LAP and TPV compared with a 109% and 11% increase in LAP and TPV after 18 months.33
The Coronary Artery Disease—Reporting and Data System (CAD-RADS) was developed as a standardized reporting system to improve assessment consistency, facilitate clinical decision-making, and guide management after CCTA.34 CAD-RADS categorizes patients according to the maximal degree of coronary stenosis, ranging from 0 (no CAD) to 5 (total occlusion). It also incorporates plaque burden modifiers (P1-P4) and ischemia testing results (I+, I-, I±). Higher CAD-RADS categories (3-5) and the presence of high-risk plaque features are associated with increased risk of MACE. Accordingly, the American College of Cardiology recommends integrating all available diagnostic information for patient risk stratification.35 However, variability in the visual assessment of coronary stenosis and plaque burden remains a challenge as interobserver differences can affect CAD-RADS categorization. Less experienced CCTA readers have a higher rate of overestimation compared with expert readers, potentially increasing the risk of unnecessary invasive procedures.36
AI and Plaque Characterization: Improving Imaging Workflows and Altering Therapeutic Management
AI-based algorithms substantially reduce interobserver variability and improve risk stratification compared with traditional visual CAD-RADS scoring. AI-based algorithms substantially reduce interobserver variability and improve risk stratification compared with traditional visual CAD-RADS scoring. AI-driven CAD-RADS assessment demonstrates excellent agreement with expert readers (weighted κ = 0.73‐0.97) and provides a high negative predictive value for ruling out obstructive disease, thereby improving workflow efficiency and reducing reporting times by up to 40%.37-39 In a post hoc analysis of the CREDENCE trial, AI-guided quantitative plaque analysis (AI-QPA) showed superior diagnostic performance compared with myocardial perfusion imaging for clinically significant stenosis (≥50% or FFR <0.8) as determined through invasive coronary angiography.40
AI-QPA showed excellent agreement with IVUS and near-infrared spectroscopy-IVUS (NIR-IVUS) for TPV, vessel and lumen roadmap, calcified plaque, noncalcified plaque, and LAP volume calculations.41,42 For long-term risk stratification, AI-QPA staging that incorporates high-risk plaque features and percent atheroma volume showed greater prognostic discrimination for MACE compared with manual CAD-RADS and clinical risk scores, with improved net reclassification and higher area under the curve (AUC) over 10-year follow-up.43 With growing adoption of CCTA, age- and sex-specific quantitative plaque normograms based on an international cohort of 11,808 patients were calculated with AI-QPA, where manual plaque segmentation would have been cumbersome and impractical.44
AI-QPA results directly impact clinical decision-making, leading to more personalized and effective management strategies for patients with suspected or known CAD. In the DECODE study, clinicians reclassified the preventative therapy plans of 66% of the patients after AI-QPA results were made available in addition to the CCTA results; when separated by CAC, preventative therapy upstaging ranged from 47% (CAC = 0) to 96% (CAC > 400).45 In the multicenter CERTAIN study, compared with conventional CCTA analysis, AI-QPA and AI-assisted FFR analysis increased physicians’ confidence in the care pathway, increased the initiation of aspirin and statins by 28.1% and 23%, respectively, and decreased the need for downstream invasive and noninvasive cardiac testing by 37%.46
Important Drawbacks of AI-QPA
AI-QPA is suboptimal below a certain plaque volume. For instance, plaque volume thresholds below 2.3 mm3 had steep negative effects on diagnostic accuracy (42% for <2.3 mm3 vs 94% for >2.3 mm3) and specificity (27% for <2.3 mm3 vs 94% for >2.3 mm3) and minimal effect on sensitivity (93% for <2.3 mm3 vs 100% for >2.3 mm3) compared with NIR-IVUS.41
Differences in AI-QPA output persist between the make and versions of software due to training data heterogeneity and proprietary algorithms affecting approach to vessel, plaque boundary identification, attenuation-based classification, and integration of clinical data.47,48 Even variability in hardware and scanning parameters can produce discordant CCTA and AI-QPA results.49 For instance, decreasing tube current from 140 kVp to 100 kVp can result in overestimation of TPV from overestimation of calcified plaque (secondary to blooming artifact), and underestimation of noncalcified plaque.50 Nonetheless, the SCCT emphasizes that standardization of annotation, segmentation, and validation protocols are essential for reliable clinical adoption. Their consensus document recommends rigorous external validation against gold standards (IVUS, invasive angiography) and independent cohorts, and highlights the need for harmonized data annotation and transfer learning to address scanner and population variability.51
AI Plaque Analysis Workflow
Overall plaque analysis workflow is similar among the 3 popular commercial vendors in the United States (Figure 1), all of whom have received clearance from the U.S. Food and Drug Administration. After a physician determines known or suspected CAD, CCTA is obtained and images are uploaded to the vendor’s server for AI-QPA. The AI algorithm’s work is double-checked for quality control by an “expert reader” who can be a physician or an experienced nonphysician reader. A report is then routed back to the interpreting physician (radiologist or cardiologist). All 3 vendors offer online platforms to manually view/interrogate the coronary tree and AI segmentation in greater detail (Figure 2).
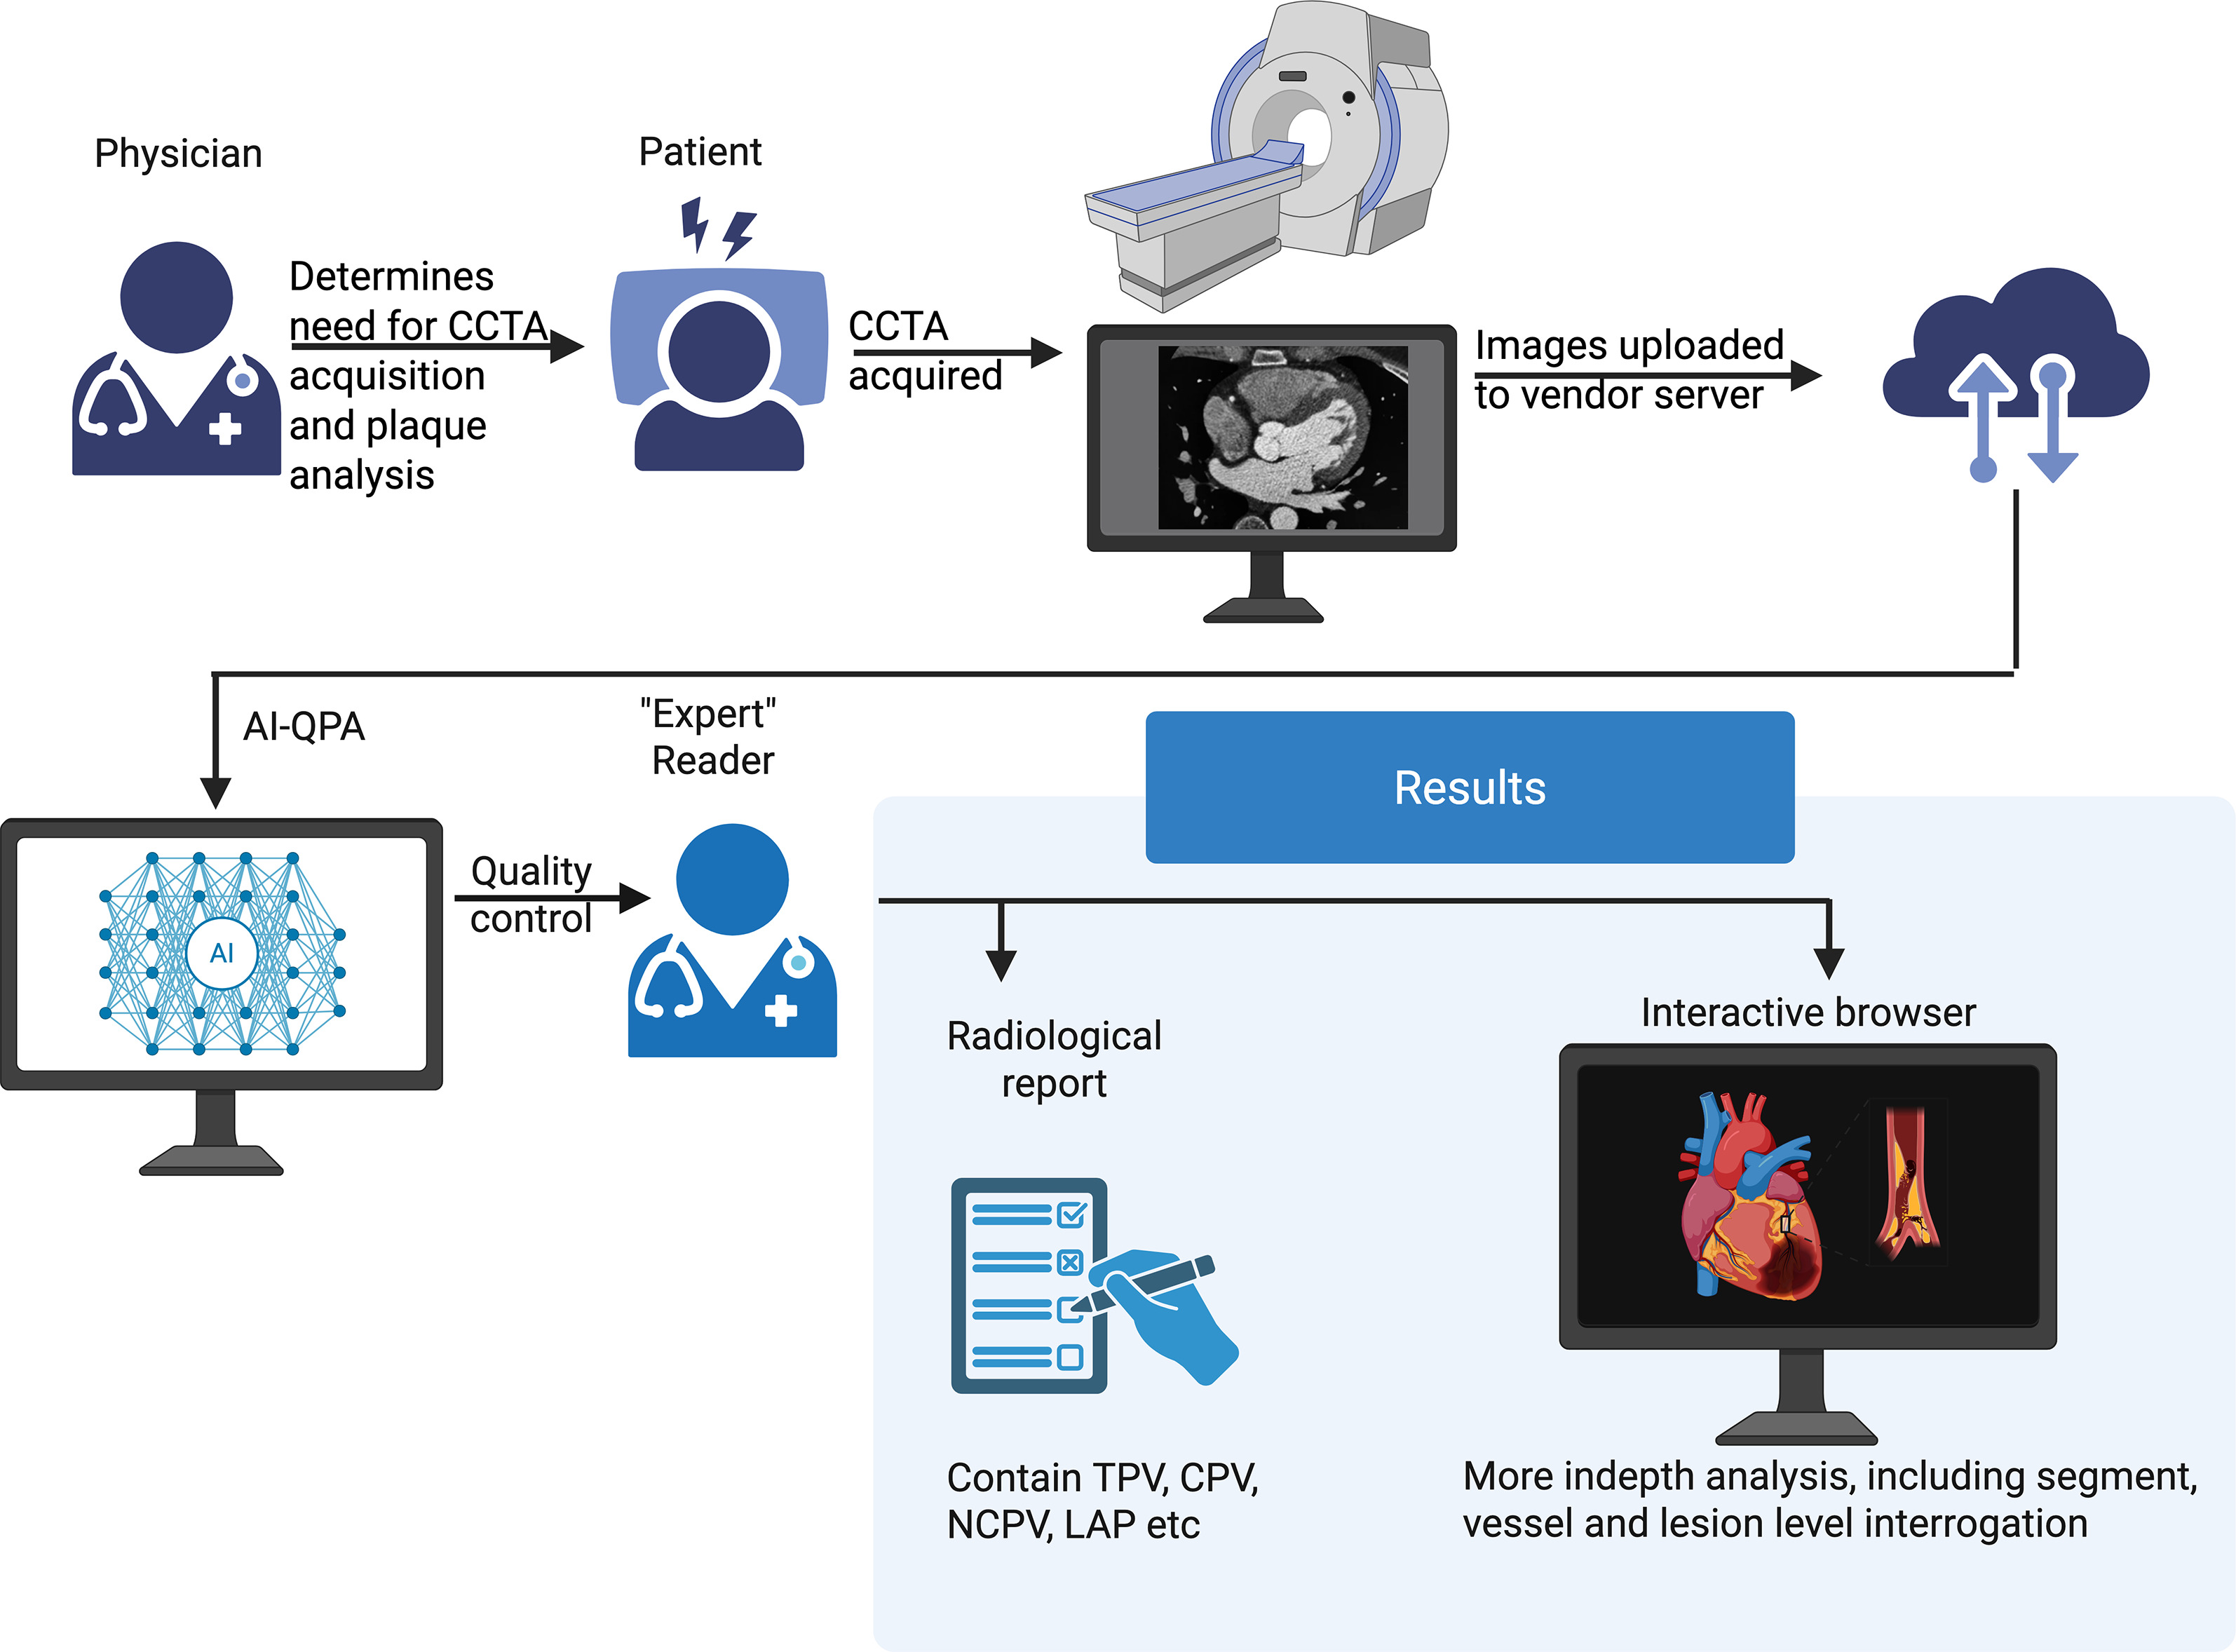
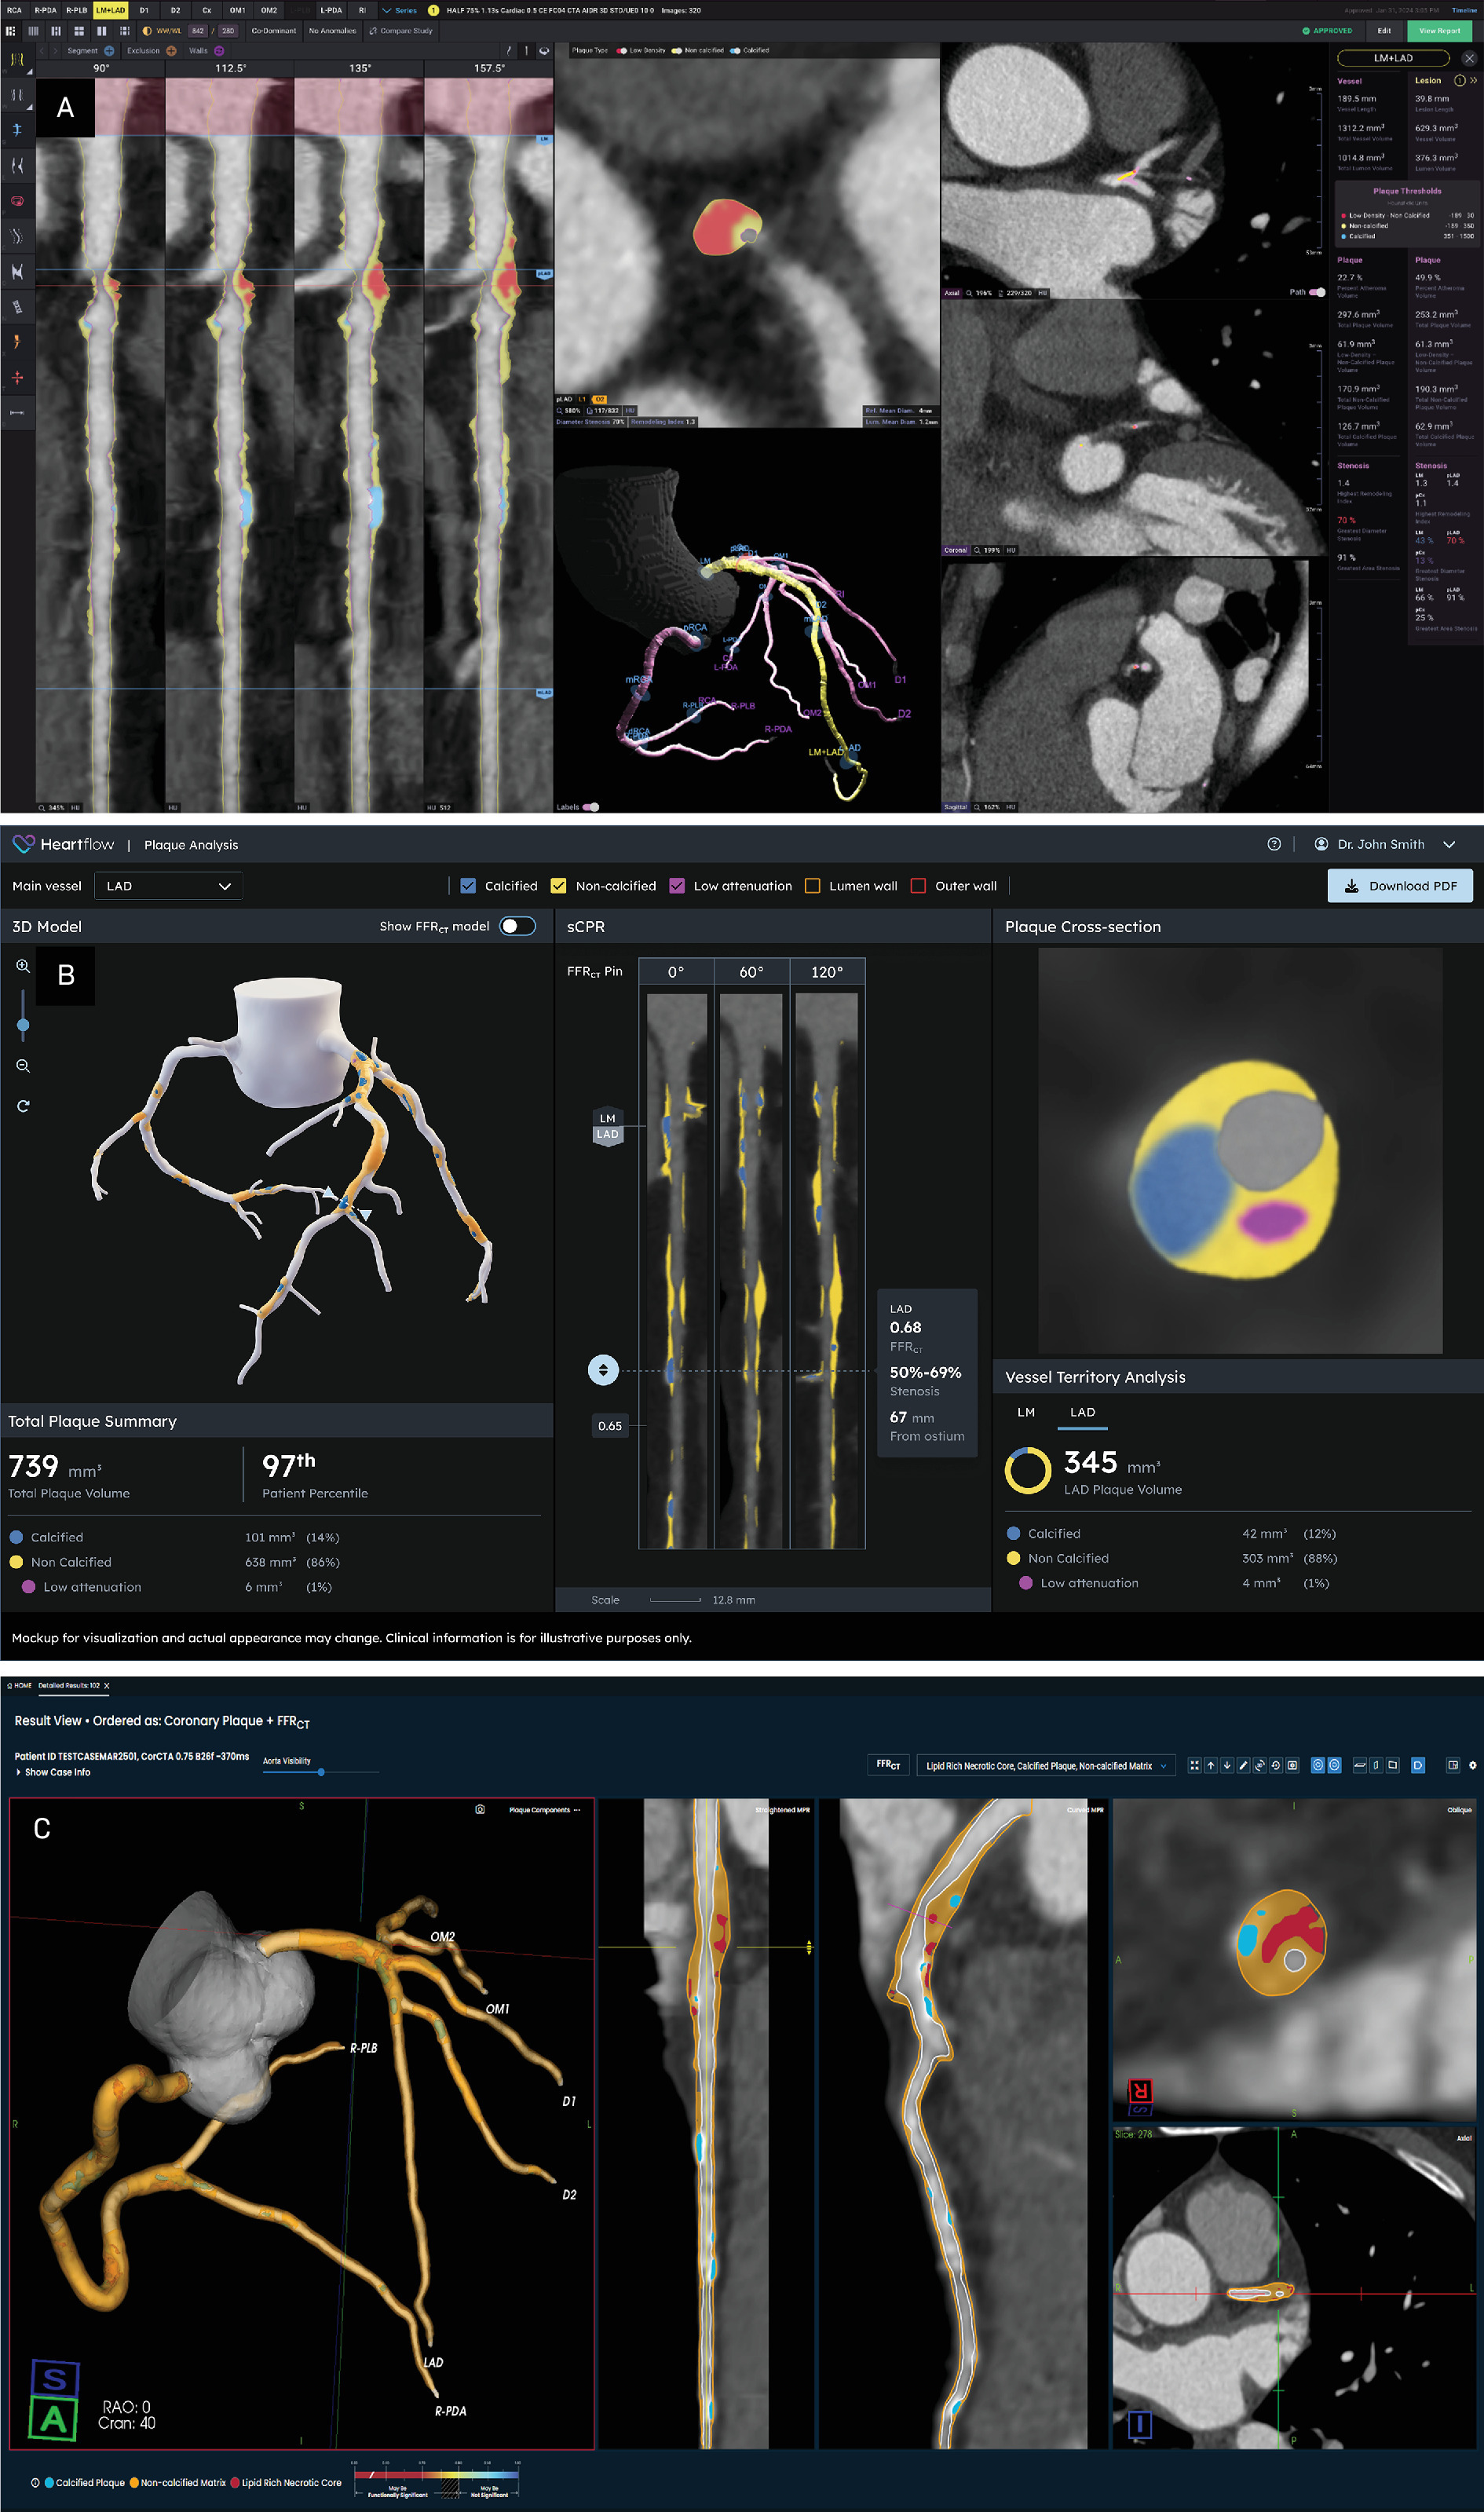
A brief discussion of the derivation and/or the performance of the 3 common vendors is provided next..
AI-QPA Platform: Cleerly
The Cleerly AI-QPA platform (Cleerly Labs, Denver, Colorado) performs automated coronary CTA analysis using an array of validated convolutional neural networks.39,52,53 The AI pipeline generates artery centerlines, contours lumen and outer wall across all available phases, selects the 2 highest-quality phases per vessel, and applies automated anatomical labeling with proximal, mid, and distal segmentation. Diameter stenosis is computed from interpolated reference diameter at the site of stenosis. Against quantitative coronary angiography in the CLARIFY study, per-patient performance (sensitivity, specificity, positive predictive value, negative predictive value, and accuracy) for ≥50% stenosis was 94%, 68%, 81%, 90%, and 84%; for ≥70% stenosis, per-patient performance was 94%, 82%, 69%, 97%, and 86%.52 On a per-vessel analysis, Cleerly’s software performed similar to level 3 cardiac CT readers but superior to level 2 cardiac CT readers (AUC = 0.86 vs 0.69, P < .001).53 Inner and outer wall boundaries are segmented and plaques are detected as tissue >1 mm³ within the wall using proximal and distal reference slices. Plaques are classified by HU thresholds; below <30 HU = LAP, between 30 HU and 350 = noncalcified plaque, and >350 HU = calcified plaque. Analyses include all epicardial vessels ≥1.5 mm. Quantitative metrics such as external elastic lamina area, lumen area, plaque area, plaque burden, and length-normalized percent atheroma volume correlate well (correlation coefficient >0.74) with IVUS and NIR-IVUS in the INVICTUS study groups.41,54
AI-QPA Platform: HeartFlow
The HeartFlow AI-QPA deep learning algorithm (HeartFlow Inc, Mountain View, California) automatically segments the vessel outer wall and lumen to quantify plaque volume.42,55 The lumen model was trained on clinical CCTA cases from HeartFlow’s FFR CCTA (FFRCT) datasets; the outer-wall model was trained on AutoPlaque annotated cases from Cedars-Sinai and HeartFlow’s FFRCT cases that included at least one vessel with > 30% diameter stenosis, supporting generalizability to symptomatic patients.
AI and structured human quality control from trained CT analysts are used to generate patient-specific 3D reconstructions of the aorta and coronary arteries from the highest-quality CCTA phase. Deep learning models segment lumen and outer wall on cross-sections orthogonal to vessel centerlines. The AI algorithm extracts the centerline of vessels ≥1.8 mm in diameter. Analysts verify and, if needed, adjust boundaries using a standardized protocol. After final segmentation, plaque volume is quantified by HU thresholds: LAP between −30 and 30 HU, noncalcified plaque at 30 to less than the calcified threshold, and calcified plaque defined adaptively as greater than 350 HU or mean luminal attenuation plus 1 SD. Quantitative metrics such as TPV and calcified and noncalcified plaque volumes correlate well (>0.87) with IVUS in the REVEALPLAQUE study.42
AI-QPA Platform: PlaqueIQ
PlaqueIQ (Elucid, Boston, Massachusetts) uses convolutional neural networks trained on carotid endarterectomy histopathologic images of atherosclerotic plaques that were co-registered to CTA images for establishing ground truth to classify individual plaque components.56,57 CCTA voxel Hounsfield values can overlap between different histopathologic tissue types such as lipid-rich necrotic core (LRNC), intraplaque hemorrhage, and other components, making them difficult to distinguish. To overcome this, the software uses spatial distribution of tissue properties instead of fixed HU ranges to interpret adjacent voxels. Regions defined by biological features are translated into color-coded segments to reduce data complexity. Key plaque characteristics such as LRNC, stenosis, remodeling ratio, dilation, and ulceration are identified using semantic segmentation to reduce variability caused by differences in scanner hardware, reconstruction settings, and contrast administration.57 PlaqueIQ performs well compared with histology-based identification of LRNC, calcified and noncalcified plaque (correlation coefficient > 0.87). Quantitative metrics such as TPV and calcified and noncalcified plaque volumes correlate well (>0.74) compared with HU threshold-based plaque identification.58 However, only modest correlation (0.54) is noted between LAP from HU-thresholding platforms and LRNC from PlaqueIQ due to significantly higher volume estimates of LAP compared with LRNC.58
Conclusion and Future Directions
Recent guidelines from US and international cardiology societies have supported a paradigm shift away from stenosis-based to plaque biology-based assessment of CAD.59 Over the past decade, robust evidence has established that quantitative plaque analysis by CCTA provides powerful prognostic insights on risk stratification and supports early clinical intervention and risk-factor modification. Contemporary CCTA reporting requires manual plaque segmentation, which can be time-intensive and show suboptimal inter- and intraobserver reproducibility. Technological innovations in AI algorithms for plaque quantification enable these assessments to be performed rapidly in clinical practice. Furthermore, myocardial ischemia is driven by plaque and vascular morphology and as much as 50% of patients with CAD have ischemia in at least one vascular territory.60 All 3 vendors are actively developing or offering tools to estimate the probability of coronary vessel-specific ischemia by calculating FFR from CCTA data (FFRCT) through plaque-based analysis (Elucid and Cleerly) or computational fluid dynamics (HeartFlow).61-63 In fact, the EMERALD-II study has shown increased predictability of ACS from combined AI-QPA and FFRCT compared with standard CCTA analysis (AUC 0.84 vs 0.78; P < .001).64
Limited reimbursement has been a significant impediment to broad US adoption of AI-QPA. Per-case pricing for AI-QPA typically ranges from several hundred to several thousand dollars, which substantially exceeds the Medicare reimbursement for CCTA, generally in the low hundreds of dollars.48 However, the momentum is shifting: the U.S. Centers for Medicare & Medicaid Services has assigned AI-QPA a Category I CPT code effective calendar year 2026, establishing a pathway for federal and state insurance program coverage.65 In parallel, multiple private insurers have announced coverage beginning October 1, 2025, which will likely promote further widespread clinical adoption.66
Increasing insurance reimbursement and widespread clinical adoption will further promote industry-academic partnerships, drive innovation, and transform clinical practice. Many prospective randomized clinical trials aim to challenge the current diagnostic and treatment norms. For example, the TRANSFORM trial from Cleerly aims to compare the performance of Cleerly’s AI-aided CAD score to the current atherosclerotic cardiovascular disease risk scores for identifying asymptomatic individuals at increased risk for cardiovascular events67; the DECIDE Registry from HeartFlow aims to assess treatment changes in clinically stable patients who undergo CCTA with AI-QPA versus CCTA alone.68
As AI-QPA adoption scales, harmonization of vendor- and site-specific acquisition and reconstruction protocols is imperative to support accurate and reproducible CCTA analyses for longitudinal comparisons. Scan to rescan variability and limits of agreement should be rigorously characterized and incorporated into analytic pipelines before attributing any change to plaque biology.